.png)

Sector Rotation: Consumer Discretionary Leads the Week
Utilities XLU led the downside and Consumer Discretionary XLY topped the current-week standings.
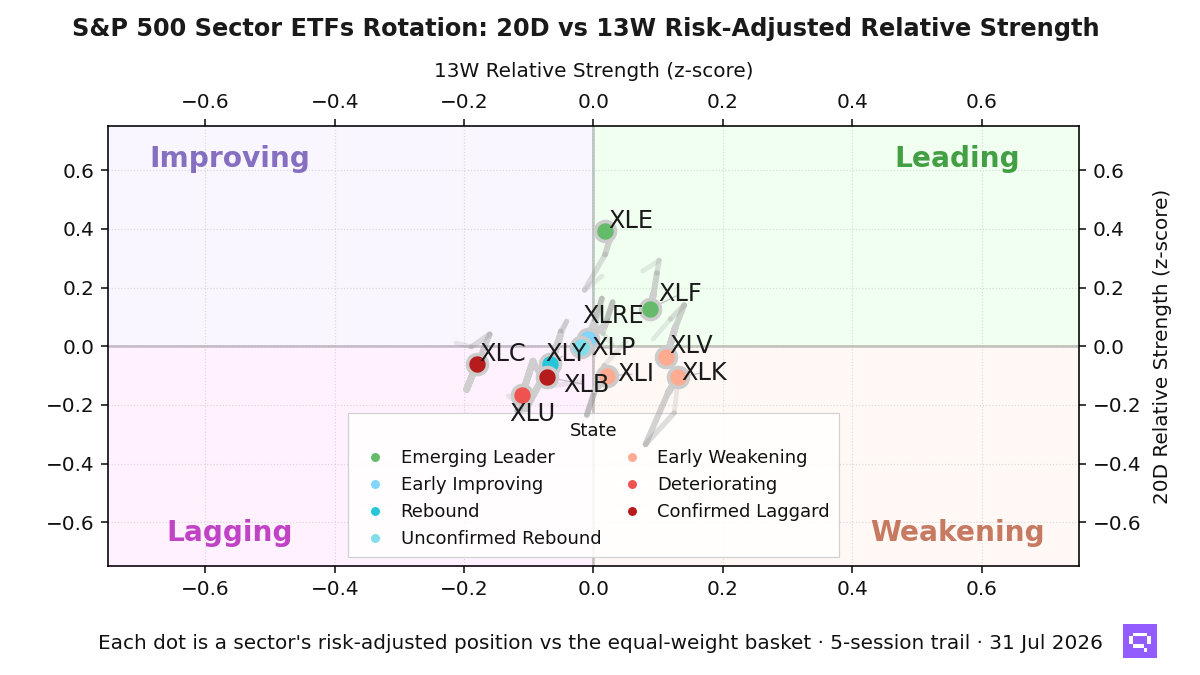
Sector selection pays close to average across the eleven S&P 500 sector ETFs, which place dispersion in a normal regime as of July 31. The z-score against its GARCH-normalised mean is +0.55, and the spread widened modestly over the past five sessions, a fresh push that is mean-reversion-prone. Five sectors sit in Lagging, three in Weakening, two in Leading, and one in Improving. The regime centers on quadrant rotation inside a mid-range spread, so sector and stock selection matter more than a single beta impulse.
Consumer Discretionary XLY posted the top weekly reading at +0.78 and rose from a lagging base into a rebound state, while its 20-day and 13-week lines both sit negative. Communication Services XLC and Financials XLF rank second and third, yet both rotated toward Weakening from opposite bases, XLC from a confirmed laggard state and XLF from Leading with mild 13-week backing. Consumer Staples XLP ranks fourth after a tactical rebound from a lagging base with near-zero intermediate backing. The upside cluster is unconfirmed, with rebounds and emerging leadership crowding the top four.
Utilities XLU led the downside rotation and fell to last at -0.85, the steepest decline in the field and a deterioration on both horizons from the Lagging quadrant. Health Care XLV and Industrials XLI faded from Weakening, Materials XLB held eighth as a confirmed laggard, and Real Estate XLRE posted the sharpest rank fade, down seven places to tenth. Energy XLE rotated up within Leading and holds sixth, yet its 13-week line is near zero, and Technology XLK sits seventh after a shallow rebound inside Weakening. Four of the eleven sectors post positive current-week readings, and two of those sit in rebound states from lagging bases, so intermediate backing is thin across the positive side.
Sector Rotation Map
Romain Gandon
CEO, Quantlake
Disclaimer: This article is for informational and educational purposes only and does not constitute investment advice. Past performance is not indicative of future results.