.png)
Dividend & small caps lead as growth stabilizes
Equity momentum across the ETFs we track stayed value- and income-tilted, with small caps and international developed also pressing into the lead. Relative to last week’s more two-sided tape, this week broadened materially, with growth no longer the sole pocket of persistent cooling even as it remained the lagging cluster.
The regime still reads as rotation rather than a single-factor tape because several leaders continued to show decoupling in correlation to SPY versus their 1-year mean alongside large positive alpha contribution. iShares Select Dividend ETF (DVY) shows correlation to SPY of 0.18 versus 0.71, and SPDR S&P Dividend ETF (SDY) sits at 0.20 versus 0.66. Vanguard FTSE Emerging Markets ETF (VWO) also remains below its norm at 0.41 versus 0.76, consistent with more idiosyncratic leadership.
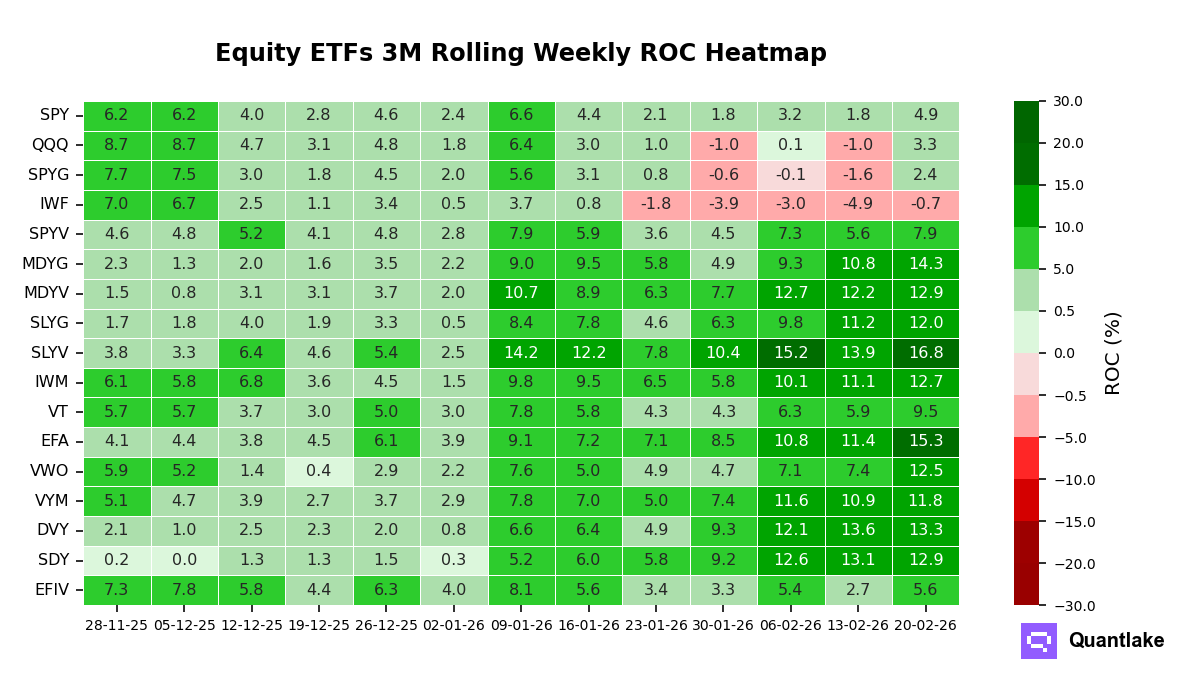
Breadth strengthened over the week: 15 of the ETFs we track showed momentum improvement and two weakened. The top week-over-week momentum improvers were Vanguard FTSE Emerging Markets ETF (VWO) at +5.1 points, Invesco QQQ Trust (QQQ) at +4.3 points, and iShares Russell 1000 Growth ETF (IWF) at +4.2 points. The weakest were iShares Select Dividend ETF (DVY) at -0.3 points, SPDR S&P Dividend ETF (SDY) at -0.2 points, and Vanguard High Dividend Yield ETF (VYM) at +0.9 points. QQQ flipped positive, and SPDR Portfolio S&P 500 Growth ETF (SPYG) flipped positive.
In level terms, SPDR Portfolio S&P 600 Small Cap Value ETF (SLYV) and iShares MSCI EFA ETF (EFA) sit in the top decile, with SPDR Portfolio S&P 400 Mid Cap Growth ETF (MDYG) close behind in the upper third. Dividend leadership remains in the upper third via DVY and SDY. Large-cap growth remains in the lower half through QQQ and SPYG, while IWF sits in the bottom decile and is the only fund still below zero.
Stretch is concentrated in a narrow set of leaders. SDY is statistically stretched with a Z-score of 2.36 and sits near its 12-month peak, flagging exhaustion risk and normalization risk. EFA is also statistically stretched at 2.27, while DVY is elevated but not extreme at 1.88 and sits near its 12-month peak, which keeps normalization risk on the radar.
Attribution continues to split idiosyncratic leaders from beta proxies. DVY and SDY pair low correlation to SPY with large alpha contribution of 12.4 points and 11.9 points, respectively, consistent with improving internal dispersion. By contrast, Vanguard Total World Stock ETF (VT) and iShares MSCI EFA Value ETF (EFIV) show correlation to SPY of 0.96 and 0.96, with more modest alpha contribution of 4.8 points and 0.9 points, behaving more like beta proxies.
Our take: Last week’s rotation framework still holds, and this week’s broad momentum improvement, alongside QQQ and SPYG flipping back above zero, extends the case for wider participation even as dividend leadership remains the most statistically stretched pocket.
![Equity ETFs 3M Rolling Weekly Correlation Heatmap [vs SPY]](https://cdn.prod.website-files.com/654bb12ba4f14cf6cef8fb8a/6999bc047f8c369234bd0048_HeatMap_BROAD_INDICES_Tactical_21022026_corr.png)
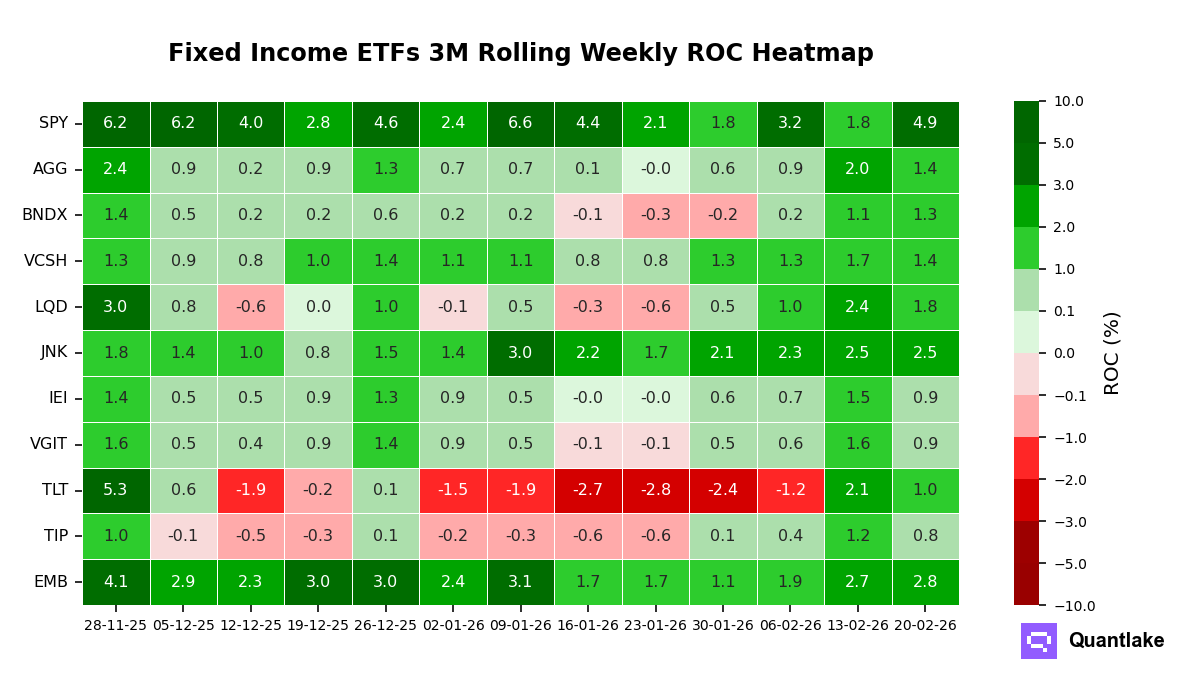
Credit stayed in front of our fixed income tape, but the curve picture rotated again versus last week as duration shifted from fast improver to clear laggard. The result is a more dispersed setup, with leadership still concentrated in spread product while Treasuries cooled.
Linkage to the broad equity benchmark continued to separate credit from duration. High yield behaved most like a beta proxy, with correlation at 0.85 versus a 0.74 one-year mean, alongside a negative alpha contribution of 1.7 points. Emerging markets debt stayed more internally driven, with correlation at 0.19 versus a 0.50 mean and a positive alpha contribution of 1.9 points.
This week’s breadth cooled: four of the ETFs we track strengthened on a three-month trailing basis, while seven weakened. The top momentum accelerations were Vanguard Total International Bond (BNDX) at +0.2 points and iShares JPMorgan USD Emerging Markets Bond (EMB) at +0.1 points. The sharpest decelerations were iShares 20+ Year Treasury Bond (TLT) at -1.1 points, Vanguard Intermediate-Term Treasury (VGIT) at -0.7 points, and iShares Core US Aggregate Bond (AGG) at -0.6 points. No constituents flipped positive or negative; all remained above zero.
In level terms, EMB and JNK sat in the top decile, with iShares iBoxx $ Investment Grade Corporate Bond (LQD) in the upper third. AGG and Vanguard Short-Term Corporate Bond (VCSH) were mid-pack, while TLT, iShares 3–7 Year Treasury Bond (IEI), VGIT, and iShares TIPS Bond (TIP) clustered in the lower half.
Statistical stretch stayed muted across the universe. Z-scores remained well inside extreme territory, and even the weakest readings, including IEI at -0.81 and VGIT at -0.80, pointed to mild under-shooting rather than a binding floor. Most funds also sat meaningfully below their 12-month momentum peaks, with TLT still 7.2 points off its high, consistent with normalization risk rather than exhaustion at an extreme.
Attribution reinforced a split between beta-sensitive credit and more defensive duration. JNK’s high, rising correlation to the broad equity benchmark signaled upside participation when equities advance, but it also implied reduced hedging effectiveness in drawdowns, and its negative alpha contribution argued against idiosyncratic leadership. By contrast, EMB combined lower-than-normal correlation with positive alpha, while the Treasury sleeve kept low to negative correlations, supporting hedging characteristics even as momentum cooled.
Our prior view that duration’s catch-up was making the tape more unified was challenged this week as the long end rolled back into the laggard seat while credit held the leadership line.
![Fixed Income ETFs 3M Rolling Weekly Correlation Heatmap [vs SPY]](https://cdn.prod.website-files.com/654bb12ba4f14cf6cef8fb8a/6999bc2a11f086a8927f4b06_HeatMap_FIXED_INCOME_Tactical_21022026_corr.png)